
The Energy Infrastructure Newsletter • Summer 2022
As an investment advisor, you have been subscribed to the Energy Infrastructure Newsletter so that you and your clients can stay abreast of this powerful emerging subsector. Formerly the MLP Newsletter, the Energy Infrastructure Newsletter is published in partnership with the Energy Infrastructure Council, a nonprofit trade association dedicated to advancing the interests of companies that develop and operate energy infrastructure. EIC addresses core public policy issues critical to investment in America’s energy infrastructure.
Energy Sector Holding Up in Volatile
Investing Environment
Advisor Access spoke with John Edwards, CFA, managing partner at Principal Street Partners.

Advisor Access: Broader markets have taken a beating so far this year while infrastructure-related strategies, particularly in energy, have held up relatively well. What are your thoughts on what is going on so far?
John Edwards: The S&P 500 has dropped nearly 18% (year to date [YTD] through June 24) and the NASDAQ is down nearly 26% YTD and over 28% since its all-time high established last November. It’s been a rough ride. But the Energy Sector is up nearly 29% YTD (after being up over 60% earlier this year) and returned over 46% in 2021. Energy infrastructure has also performed well. The Alerian Midstream Energy Index (AMNAX) is up nearly 8% YTD on a total return basis after delivering over 36% in 2021.
Energy is the only sector that is working so far in 2022. Asset managers and portfolio managers have been shedding risk in response to both elevated inflation levels, the forward market discounting another 1.75–2.00 percentage point increase in the Fed Funds rate or a year-end of 3.50%–3.75%, and increasingly hawkish rhetoric from the Fed. Furthermore, post WW2 history shows that when the Consumer Price Index tops 5%, a recession has always resulted, and the last reading for May was 8.6% up from 8.3% in April and vs. 8.6% in March. Given those kinds of statistics, we thought that 2022 would be a challenging year for most investors. Unfortunately, our outlook has been validated so far.
AA: How are you thinking about likely performance going forward?
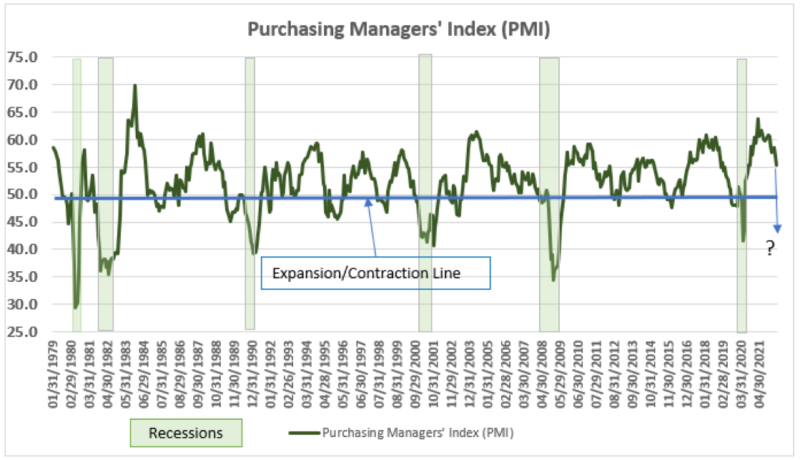
JE: We believe that most asset classes are likely to be more volatile and face more headwinds than what we have seen the past several years. While the pull back in equities has been significant, the key question on the minds of many investors is how long is the volatility likely to last. The short answer is that we believe interest rates are likely to peak toward the end of this year or the first half of next year, and the leading economic indicators, such as the PMI (Purchasing Managers’ Index), usually bottom out about 18 months after that, meaning the market bottoms out around that time as well. Bottom line is we have a rocky road ahead of us for quite some time, all else equal.
AA: Barring new data points, can you explain in a little more detail why you believe the volatility is likely to last for that long?
JE: There are a number of reasons:
1. We believe that the last interest rate hike will not be until December at the earliest. Bond rates tend to peak about three months after the last Fed Funds rate hike, meaning peak rates 1Q23 at the earliest. Long duration equities such as growth stocks are more sensitive to interest rate changes. Given the Fed has promised 50–75 basis point (bp) rate hike for the July meeting, 50–75bp expected for September, and the market discounting 1.75–2.00 incremental percentage points by the end of this year, we believe there is quite some time before we can see sustainable upside in the market in general.
2. Housing, which represents approximately one-sixth of the economy, is likely to slow down significantly, albeit from very strong levels. With house prices up 20+% year-over-year (y/y) and the 30-year mortgage rate roughly double from a year ago, the cost of owning or purchasing a home is up more than 50% y/y. With national inventories still low, we believe the slowdown is just beginning.
In turn, the slowdown in housing is likely to contribute to a continuing drop in the PMI which is highly correlated to stock market returns. The ISM (Institute for Supply Management) indices typically bottom 18 months AFTER interest rates peak. Therefore, even if we assume that interest rates have already peaked, there is high probability that we are months away before the interest rates of today are fully reflected in equities, despite the sharp pull back in equity markets YTD.
Note below that the ISM PMI data is rolling over to the downside since peaking in October of 2021.
Source: Factset
JE: Stock market returns are strongly correlated to the PMI data, as shown in the chart below.
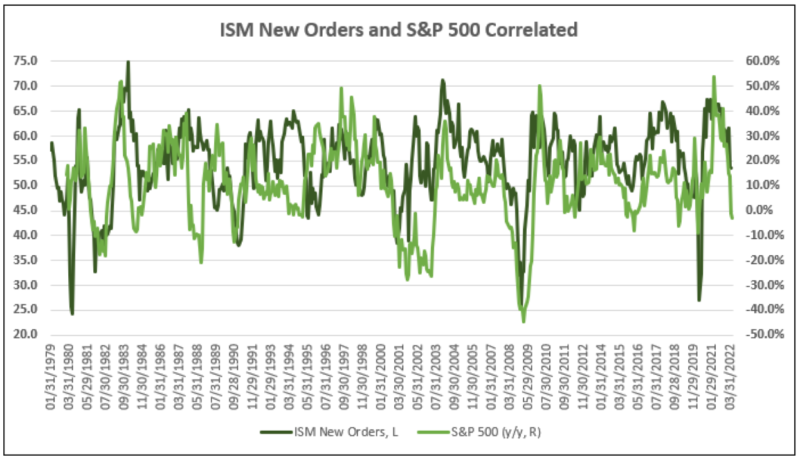
Source: Trahan Macro Research, Principal Street, Factset
JE: As far as duration, note that the ISM index usually bottoms ~18 months after the peak in interest rates, as shown in the chart below.
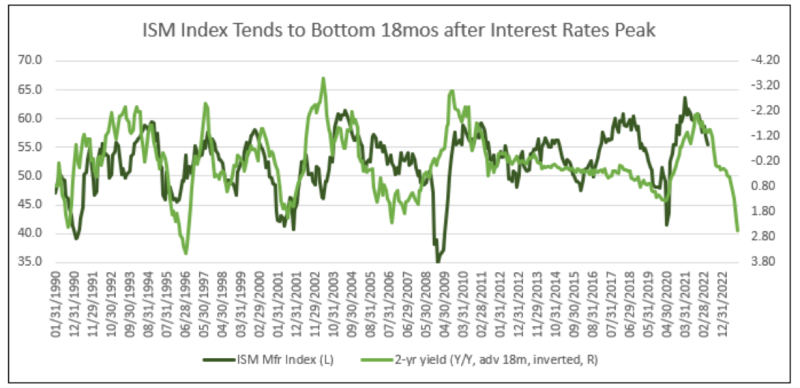
Source: Trahan Macro Research, Principal Street Partners, Factset
AA: With sustained pressure on the broader market likely to continue, what sectors in the market do you believe have the best chance of delivering positive or at least outperformance going forward?
JE: We believe that the energy sector is likely to deliver positive returns in the coming months despite the already strong year we talked about earlier. This includes pipelines and storage, which tend to outperform in a rising interest rate environment and in an overall bullish energy environment.
As for the broader energy sector, there are a number of fundamental reasons of why we believe the energy sector is likely to continue to perform well despite recent volatility:
1) Global oil inventories have come down by 700–750 million (mm) barrels since July 2020 to roughly 350mm barrels below the average of the last seven years. To put that into context, inventories are near the levels seen during the 2010–2014 period when oil averaged $85–115/bbl.
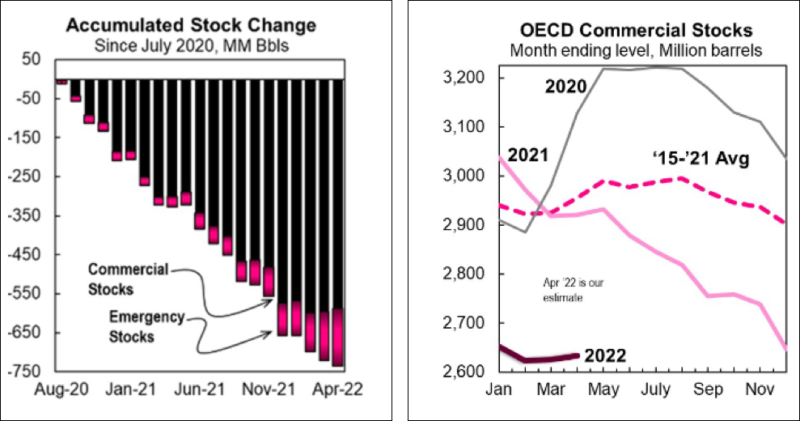
Source: Mike Rothman, Cornerstone Analytics
2) Energy capital expenditures for 2022 are still below average for the 2000–2021 time frame and below where they were in 2018–2019, as shown in the figures below.
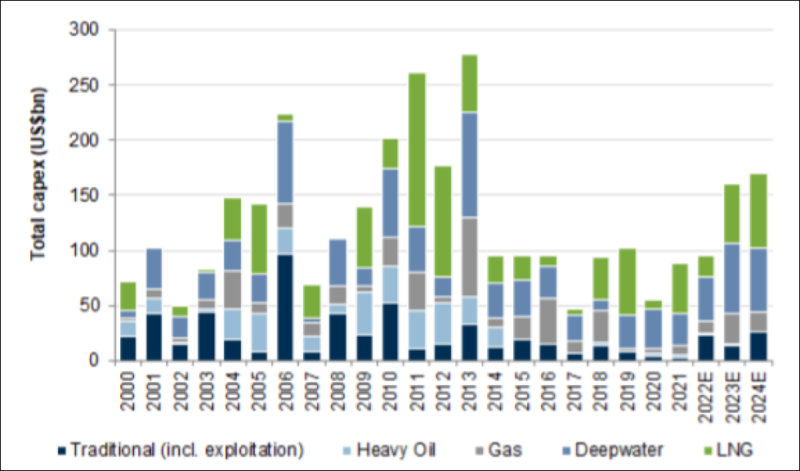
Source: Goldman Sachs Investment Research
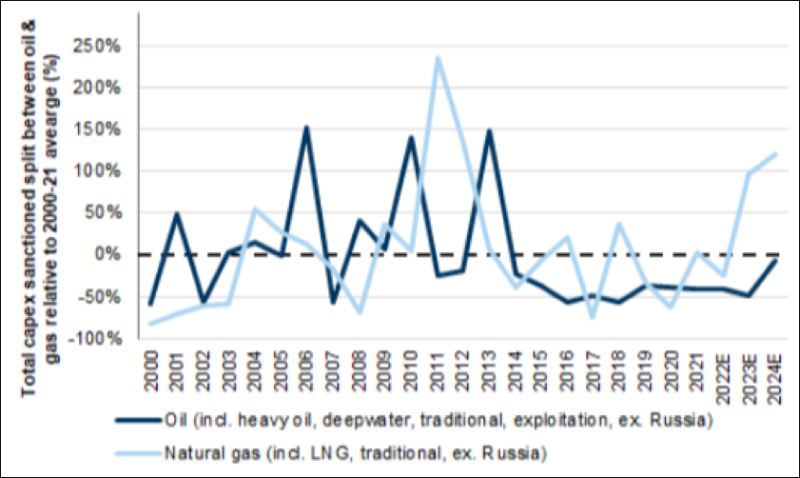
Source: Goldman Sachs Investment Research
3) Policy uncertainty has tended to raise investment hurdle rates and created greater cautiousness as far as investment/capital spending from oil and gas producers.
4) Most oil and gas producers incentivize management based on return on invested capital instead of production metrics that were the focus in the past.
5) OPEC members are underproducing their quotas largely because in aggregate the members do not have the ability to meet, let alone beat quotas.
6) The weighting of the energy sector in the S&P 500 has increased by approximately two percentage points (to >5%) over the last 12 months, which suggests that a virtuous cycle has emerged as index funds must add to energy positions to avoid basis errors.
7) Time spreads in the oil price structure also suggest bullish sentiment.
8) Given Russia supply disruptions, China lockdowns were the likely reason that crude oil prices faded earlier this spring. However, China has recently announced lifting of Covid restrictions and stimulative policy initiatives such as tax relief and new investment projects. While the uneven lifting of restrictions may overshadow the stimulative policy initiatives in the near term, lifting Covid restrictions and new investment projects are bullish for oil prices.
9) On May 30, the European Union announced plans to embargo seaborne Russian oil that will cover roughly two-thirds of total European oil imports from Russia almost immediately and an estimated 90% by the end of 2022. Russian oil production is already down about 1 million barrels per day and rerouting Russian oil normally bound for Europe to other importers means that OPEC and non-OPEC exporters have to reroute to Europe. This significant disruption in logistics in Russian oil is also likely to be bullish for oil prices.
AA: What is your view on the outlook for energy infrastructure?
JE: Investment performance from 2014 to the first half of 2020 was unfavorable. But we believe that energy infrastructure has turned the corner and has a favorable outlook even after delivering returns in the mid-30% range in 2021 and the high single digits to low mid-teens so far this year. The bear market that lasted six years from 2014 through the first half of 2020 saw excess capital spending, repeat distribution reductions, stretched balance sheets, and greater enthusiasm for renewable energy, resulting in poor returns for energy infrastructure investors.
In the chart below, the ramp in capital expenditures from 2014 to the peak in 2019 can be easily seen.
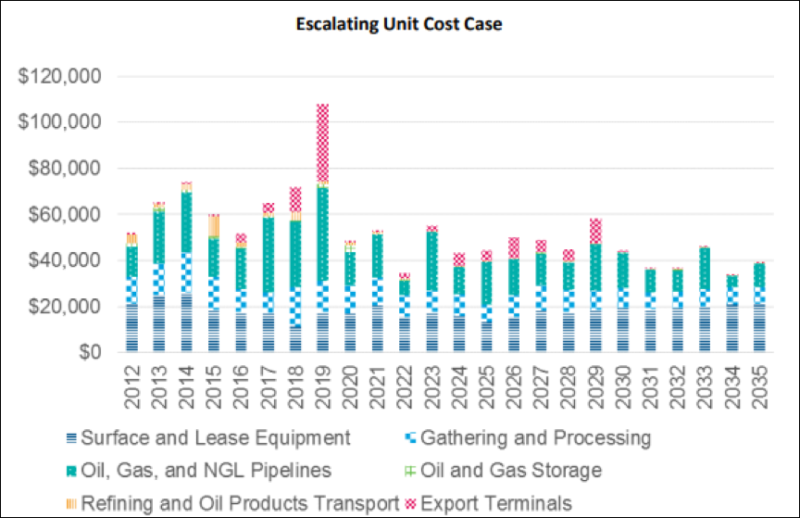
Source: INGAA Report of 6/18/2018
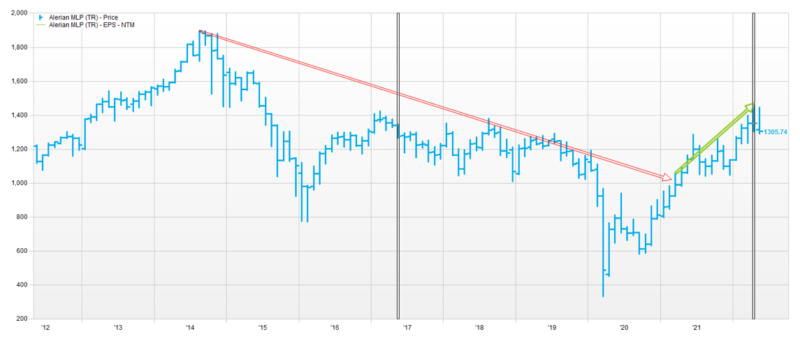
JE: The excess capital spending led to falling valuations from 2014 to the first half of 2020 before beginning what is a bullish trend since the second half of 2020.
Source: Factset
JE: The chart below shows that Enterprise Value/Earnings Before Interest, Taxes, Depreciation and Amortization (EV/EBITDA) valuations reached peak levels in 2014. As shown in the chart below, the sector EV/EBITDA multiple lost roughly 3 to 3.5 turns from the 2014 peak to where multiples are today. Even with the substantial gains in the midstream indexes over the last two years, valuations as measured by EV/EBITDA remain roughly one standard deviation below average, which helps contain downside risk amid the bearish trend in broader markets.
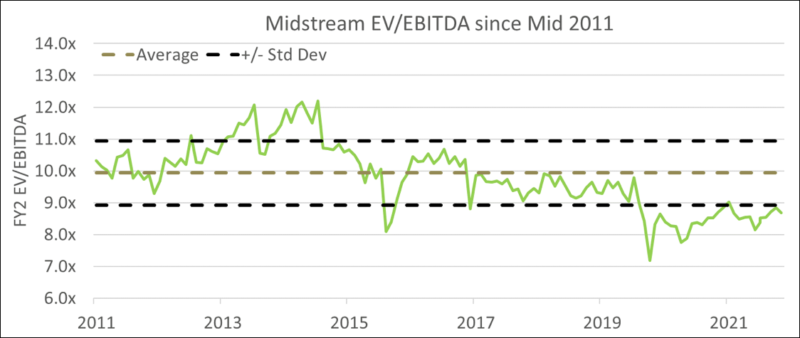
Source: Credit Suisse Equities Research
JE: In terms of the more optimistic outlook going forward, we see the following positive attributes:
1) Value. EV/EBITDA multiples at the low end of the range over the last decade as shown in the chart immediately above.
2) Financial Strength/Safety. Balance sheets stand at the strongest levels in many years with leverage likely to head even lower and strength heading even higher as shown in the figure below.
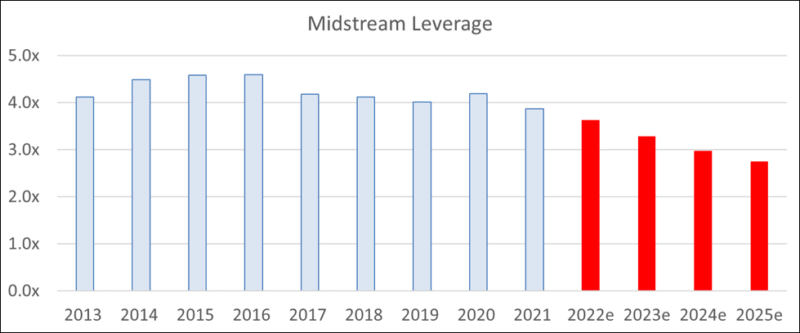
Source: Credit Suisse Equities Research
3) Growth. Mid-single digit EBITDA growth rates expected for at least the next two years on average. We expect lower single digits for large, diversified players and higher mid-single digits for the gathering and processing companies and crude and refined products pipeline/storage players.
4) Income. Attractive dividends with yields averaging ~6% for the large cap diversified midstream players to ~8% for the gathering and processing and crude and refined products transport players.
5) Sentiment has changed for the better. Despite the energy transition to renewables, the Ukraine-Russia war has brought increased focus on energy security.
AA: With the recent sell off in the price of oil, energy, and energy infrastructure, what are your thoughts regarding downside risk in energy infrastructure?
JE: While energy infrastructure has indirect and not direct exposure to the price of oil, the energy infrastructure equities are positively correlated with the price of oil. We took a look regarding the downside risk considering the recent pullback in both the price of oil as well as energy infrastructure. If we look at history, global energy demand has only contracted twice over the last four decades—during the global financial crisis in 2008 and during the recent Covid-19 pandemic. Global energy demand grew during the 1990–91 U.S. recession as well as during the 2001 recession, just at a slower rate. Furthermore, global oil inventories are more than 10% below the average of the last seven years and even if global GDP growth were to slow by 100bp during 2H22, the draw on global inventories is on track to be more than 20% below the average of the last seven years by the end of 2022. Moreover, OPEC is reaching the limits of its production capacity. Saudi Aramco has said it would take them five years to add 1MM bpd of production capacity. Our belief is that the recent pullback is because the financial market for oil is nearly 30x the physical market for oil. That implies that the recent sell off may have been due to hedge funds or generalists that reacted to the high May CPI print released June 10 and the subsequent 75bp rate hike by the Fed just days later. Bottom line is that outside of a shock to the global economy, given how tight the supply/demand balance is, there are too many factors supportive of higher, not lower, oil prices.
AA: How are you thinking about utilities?
JE: At a macro level, utilities typically outperform during periods when economic growth is slowing and the Fed is hiking interest rates, and underperform when the Fed is cutting rates and/or is engaging in quantitative easing. The chart below, which shows utility returns minus the S&P 500, helps explain why we believe utilities have a good chance at outperforming in the current rate hiking and/or recession cycle. Note how utilities perform better during rate hiking cycles, which is the opposite compared to what conventional wisdom suggests. Utilities also tend to outperform heading into or during recessions. Given that the consensus is for at least two more 75bp rate hikes, a futures market that suggests an additional 175–200bp in rate hikes by the end of the year, and a market that believes that recession risk is a rising probability heading into 2023, utilities appear to be a reasonable alternative for investors.
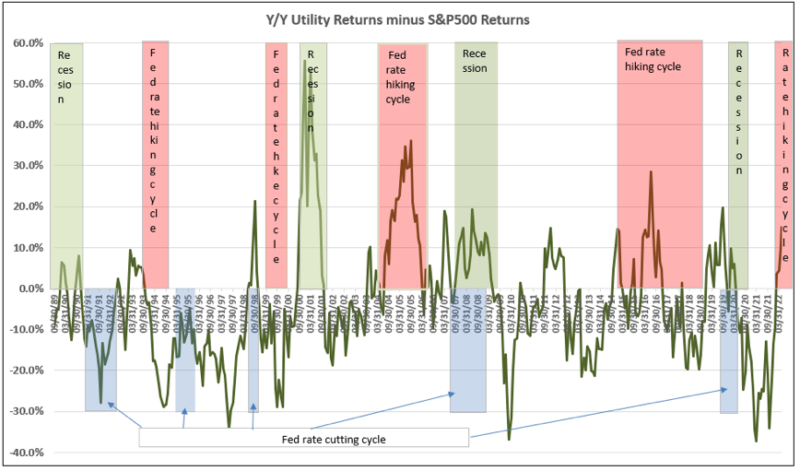
Source: Principal Street, bankrate.com, Factset
AA: Which characteristics do you look for in specific utilities?
JE: We look for companies that own assets in areas where the regulatory climate is constructive, rates and/or consumer electric bills are in the lower half of the U.S., earnings per share (EPS) and dividends per share (DPS) growth outlook is above average, and valuation is reasonably compelling. It’s challenging to find companies that offer all of those characteristics, so we have to make some trade-offs and judgments in stock selection. For example, we find that companies that have consistently delivered above average EPS growth, above average dividend growth, with positive regulatory relations, and above average growth prospects tend to trade at more expensive valuations. Companies that may have similar EPS growth prospects but a weaker historical track record, higher consumer electric bills, less than stellar regulatory relations, a management team that is not quite as well regarded and has gone through a recent acquisition understandably trade at less expensive valuations.
AA: Any concluding thoughts?
Yes. We are in a completely different investing environment than a year ago as we have transitioned from a very accommodative Fed to a hawkish Fed and are dealing with much higher inflation levels that is challenging investors regardless of experience. We believe that these more defensive types of asset classes represent a way to manage risk through this environment while generating decent income in the process.
AA: Thanks, John.