
The Energy Infrastructure Newsletter • Winter 2021
As an investment advisor, you have been subscribed to the Energy Infrastructure Newsletter so that you and your clients can stay abreast of this powerful emerging subsector. Formerly the MLP Newsletter, the Energy Infrastructure Newsletter is published in partnership with the Energy Infrastructure Council, a nonprofit trade association dedicated to advancing the interests of companies that develop and operate energy infrastructure. EIC addresses core public policy issues critical to investment in America’s energy infrastructure.
Midstream Equity Holders Benefit from Durable Cash Flows, Capital Discipline, and Return of Capital
 By Sean Maher, RCH Energy
Hydrocarbon demand continues to grow globally, and we believe U.S. shale will remain the primary source of incremental supply, globally, of crude oil, natural gas, and natural gas liquids (NGLs). Significant investments, now completed, in infrastructure have enabled select midstream companies to integrate from the producer to the end-user.
Over the last two years, cash flows strengthened balance sheets via debt repayment, and are now transitioning directly to equity investors through higher dividends and share repurchases. This is enabled by midstream companies’ ability to generate stable, long-lived cash flows.
Midstream Assets Crucial to Making Hydrocarbons Available to End-Users
Midstream assets are generally the pipelines, processing facilities, export docks, storage terminals, trucks, trains, and ships that allow end-user customers access to the hydrocarbons that we take for granted. Gasoline (driving), heating oil (warmth), jet fuel (transportation of passengers and goods), natural gas (electricity, heating), propane (heating, cooking, plastics), and ethane (plastics feedstock) are all hydrocarbons consumed through daily activities.
Without midstream assets to transport these molecules from the supply-long resource plays (i.e., The Permian Basin) to the end-users via the most complex refining and petrochemical network globally (the U.S. Gulf Coast), none of these uses would be practical or economically viable. Hydrocarbons that fuel the world and allow for economic growth require midstream assets.
Source: RCH Energy, BP Statistical Review of World Energy, EIA
U.S. Provides Most of Hydrocarbon Supply Growth
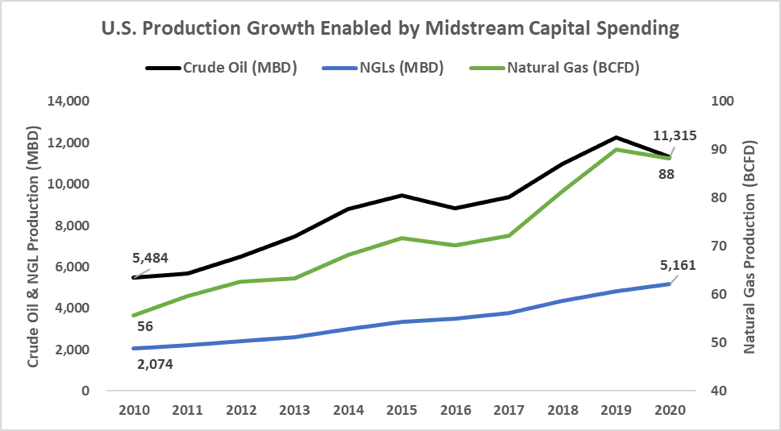
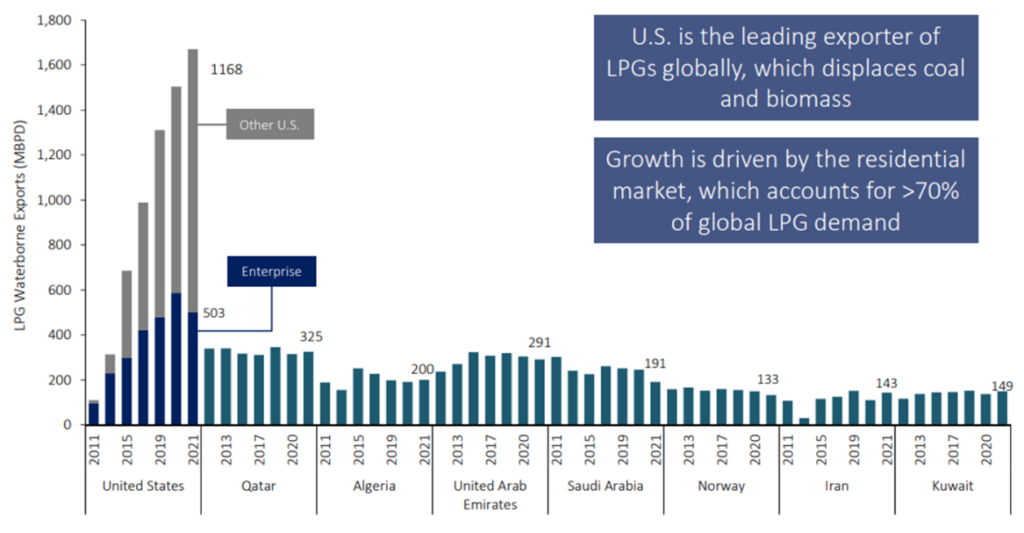
Over the last 15 years, U.S. shale production has grown significantly, and to bring those new volumes to market has required new midstream infrastructure, which is capital intensive, albeit long-lived. Today, the U.S. is a leading exporter of natural gas and natural gas liquids, along with the traditional exports of refined products (gasoline and diesel). The U.S. has provided the vast majority of additional global crude oil, natural gas, and natural gas liquids supply growth over the last 10+ years.
U.S. liquids production (including NGLs) grew by nearly 9% per year, doubling the output in 2010, with a 2021 estimate of ~16.5 million barrels/day (MMBD). Natural gas production increased by almost 40 billion cubic feet/day (BCFD) over the same period, at a rate of 5.5% per year. The U.S. now produces roughly twice the amount of hydrocarbons it did in 2010.
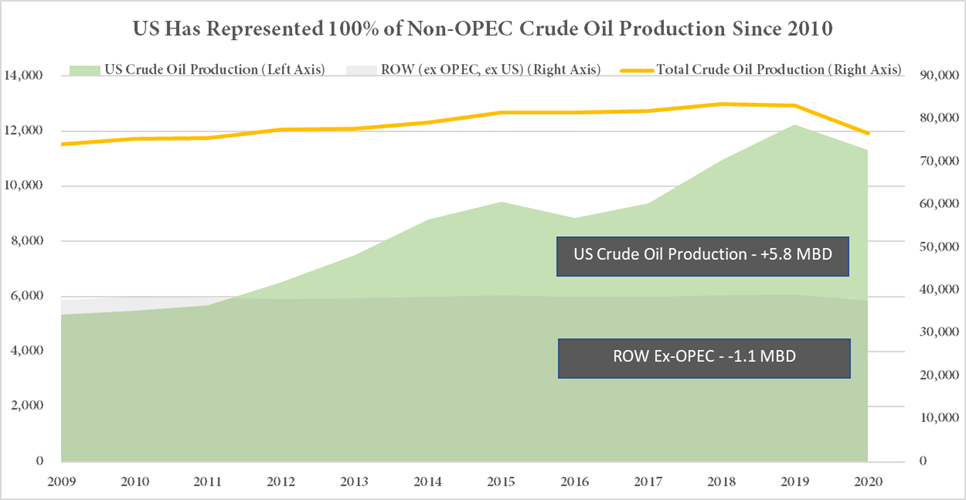
As shown in the exhibits below, the United States’ supply growth over the last decade offset the lost production seen in the rest of the world (EX-OPEC) of ~1.1 MMBD and was the significant majority of total NGL supply growth. For the better part of a decade, the U.S. has been supplying increased electrification, petrochemical production, and improved quality of life, all facilitated by the midstream businesses that brought it to the market.
Source: RCH Energy, BP Statistical Review of World Energy, EIA
Source: Enterprise Products

Source: RCH Energy, BP Statistical Review of World Energy, EIA
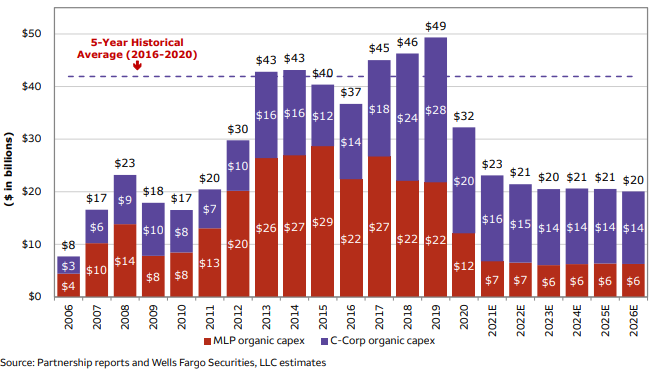
Per the below, midstream capital spending increased materially over this period. Wells Fargo estimates that midstream companies spent approximately $530 billion to build out infrastructure over the last decade. Capital spending ramped in 2013, and investment in these long-lead-time projects continued through 2019. We began to see a decline in 2020, which we believed would be a “turning point” for the midstream investor as capital budgets were falling, exploration and production (E&P) was growing (into already constructed assets), and free cash flow was predicted to rise.
These events occurred, and the global pandemic in 2020, perhaps unexpectedly, actually improved the long-term outlook for midstream companies as E&P companies began to live within cash flow at a more meaningful rate net of negative oil prices and therefore did not require or support additional midstream capital investment.
Not All Midstream Companies Are Equal
As shown in the previous chart, the total capital expenditures of the Wells Fargo coverage universe are forecasted to be less than 50% of prior levels over the next five years. However, if one delves further into the unique operating business of some of these companies, one will realize that some capital budgets run at less than 25% of their prior five-year average. The market has long viewed midstream companies as homogeneous with little differentiation in businesses and, as such, valuations.
Within RCH Energy, we run a concentrated and focused portfolio that targets what we believe to be those midstream assets that offer the best risk-adjusted return based on their management teams, balance sheets, and operating assets; not all midstream is created equal. For example, some companies offer a full suite of attractive options to large producers, export products internationally, or deliver a suite of nuanced services to benefit the global economy. These companies gather, store, process, transport, and export their producer and downstream customers’ products.
Source: RCH Energy Portfolio Companies, Bloomberg
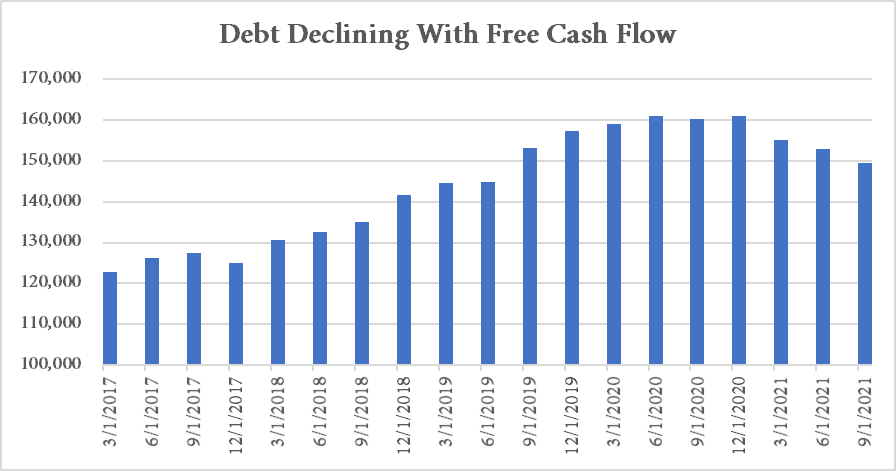
Retiring Debt
While midstream investors have been waiting, somewhat impatiently, for a general decline in balance sheet debt, we commend the discipline we saw within our portfolio as our companies paid down nearly $11 billion of debt since June 30, 2020. This amount represents approximately 7% of their current equity market capitalization and 8% of their total debt outstanding. Over that period, Debt/EBITDA ratios declined from 5.5x to the low 4.0x level; some are predicted to be 3.0x by year-end 2022 even as share repurchases accelerate.
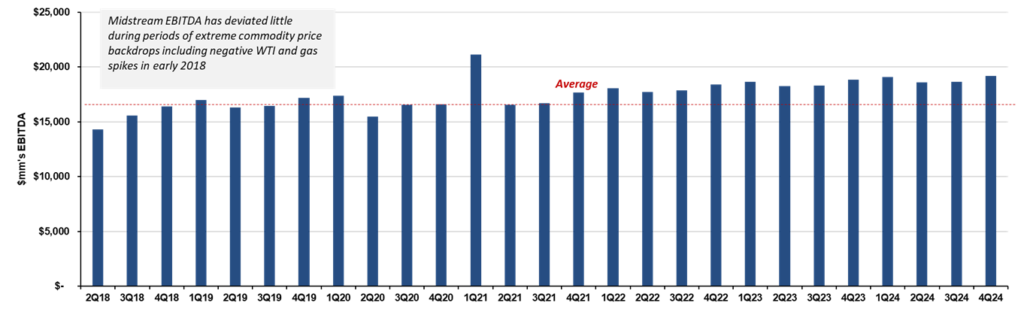
Looking forward, we forecast EBITDA will continue to grow modestly; however, with the significant declines in CAPEX, we can see a material improvement to free cash flow after CAPEX and dividends. Importantly, in our view, several companies proactively communicated that in 2022 they will be raising their dividends and buying back their equity in the open market, and in some instances, this has already occurred in 2021.
 Source: RCH Energy, EvercoreISI Coverage Universe
Source: RCH Energy, Evercore ISI Coverage Universe
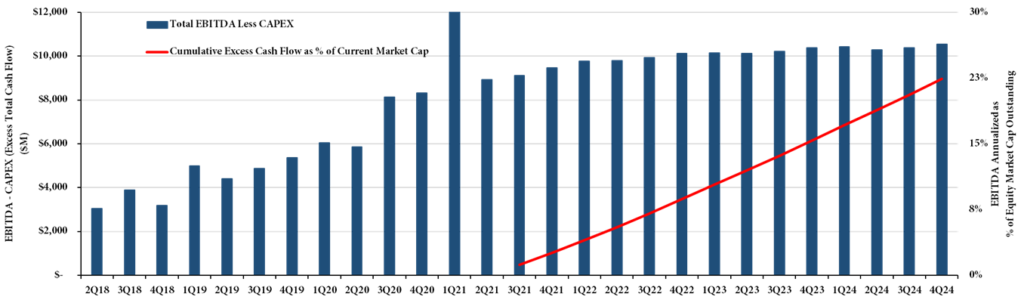
Moves Accretive to Equity Holders
We believe the retiring debt and improvement in leverage ratios are accretive to the equity holder. As an example, one non-IG rated company recently issued a 10-year note at 3.25%. Its improved ratios, the positive outlook by the rating agencies, and visibility to durable cash flows highlighted the attractiveness of these income streams via yield to the debt market. Furthermore, this cash flow is recurring, and the projected cumulative excess free cash flow (after CAPEX and dividends) between 3Q21 and 4Q24 represents approximately 23% of the current equity market capitalization of the midstream companies included in the chart.
 Source: Wells Fargo, Wells Fargo Coverage Universe
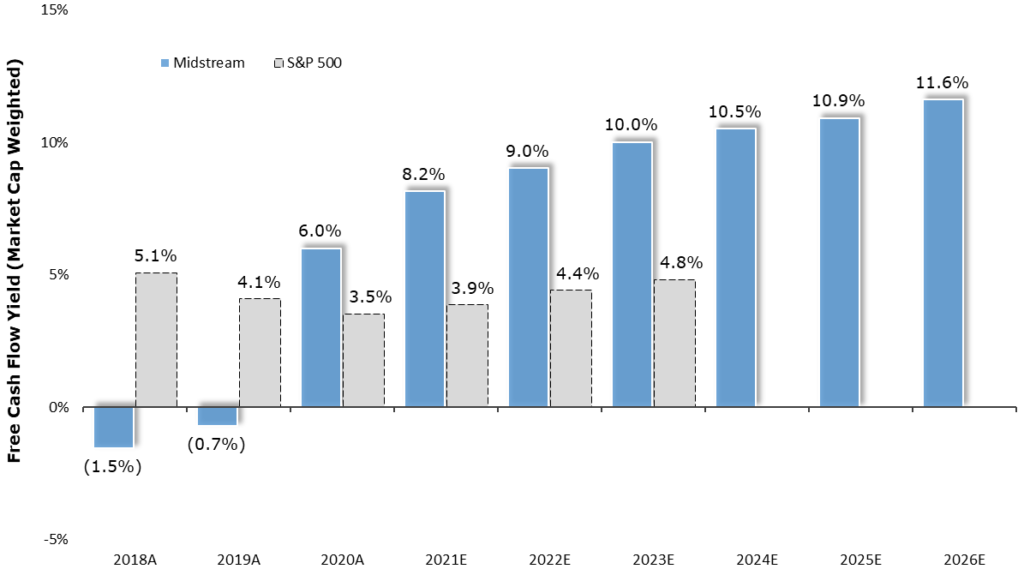
Wells Fargo Equity research presented that the midstream companies’ current free cash flow yield is compelling versus the S&P 500. Additionally, hydrocarbons’ importance for baseload power generation has become more appreciated due to the record high power prices in Europe and Asia. When the “intermittent” aspect appears via a lack of wind or solar, the only reliable baseload supply source is highlighted as hydrocarbons.
We believe that the majority of future hydrocarbon growth will likely come from “The Country Permian,” and as such, companies tied to this basin and the U.S. Gulf Coast or export markets are competitively positioned to differentiate themselves via the quality and growth of their cash flows.
 Source: RCH Energy, JP Morgan Equity Research
Conclusion
In summary, the midstream asset class spent $530 billion to build out the infrastructure network to bring U.S. hydrocarbon supply to the global market. In 2020 and 2021, companies significantly improved their leverage ratios and free cash flow yields on equity.
We believe 2022–2025 will represent a further return of capital to investors via increasing dividends/distributions and share/unit repurchase in the best-of-class companies that provide integrated services within the most competitive markets in the world. The attractiveness of high current income, underlying solid credit metrics, and improving free cash flow on equity yields (via reduced capital spending) will accrue to the long-term benefit of the equity holder, in our view.
Sean Maher, Partner – Mr. Maher has been Senior Portfolio Manager/Partner of RCH Energy since 2008 and is a Partner in RS2 Ventures. Prior to joining RCH Energy, Mr. Maher was the Head of Midstream and Natural Gas Equity Research at Morgan Stanley. Mr. Maher preceded that experience as the Senior Associate to the head of Energy Equity Research, focused on the global crude oil, and refining margin forecasts, while covering the Global Integrated Oils and Independent Refiners. Prior to joining Equity Research in 2001, Mr. Maher was in the energy investment banking group at Morgan Stanley and began his career in 1997. Mr. Maher graduated from St. Bonaventure University with an MBA and BBA in Finance and currently serves on the Board of Trustees at the Houston Museum of Natural Science (Chair of the Investment Committee), and Annunciation Orthodox School (Chairman, Strategic Planning Committee).
Important Disclaimer: This report does not constitute a recommendation to buy or sell any security or asset class discussed herein. Certain statements reflect the opinions of the author as of the date written, are forward-looking and/or based on current expectations, projections, and/or information currently available. The author cannot assure future results and disclaims any obligation to update or alter any statistical data and/or references thereto, as well as any forward-looking statements, whether as a result of new information, future events, or otherwise. Such statements/information may not be accurate over the long-term. The views are those of the author acting in his individual capacity and not as a representative of RR Advisors, LLC (the “Firm”); in no way does this report constitute investment advice on behalf of the Firm.