
The MLP Newsletter for Advisors • Summer 2019
Click HERE to download a printable PDF of this newsletter.
As an investment advisor, you have been subscribed to the MLP Newsletter so that you and your clients can stay abreast of this powerful income-generating sector. Published quarterly, the MLP Newsletter includes valuable information and expert opinion about MLPs that you cannot get anywhere else.
The Master Limited Partnership Association (MLPA) is a trade association representing the publicly traded limited partnerships (PTPs) that are commonly known as master limited partnerships (MLPs), and those who work with them.
Who’s the Incremental Buyer?
By Becca Followill, Senior Managing Director, U.S. Capital Advisors

Midstream Outperformance . . . but C-Corps the Big Winners
Midstream stocks have been nice outperformers in 2019, despite an abysmal energy tape. But the bulk of the outperformance for MLPs has been a rebound from the major correction we saw in December 2018. Large-cap midstream C corporations (Enbridge Inc.
So, why the C-corp outperformance? Will the AMZ catch up? And what does it take to get the MLPs moving materially higher?
Money Flows Are Critical
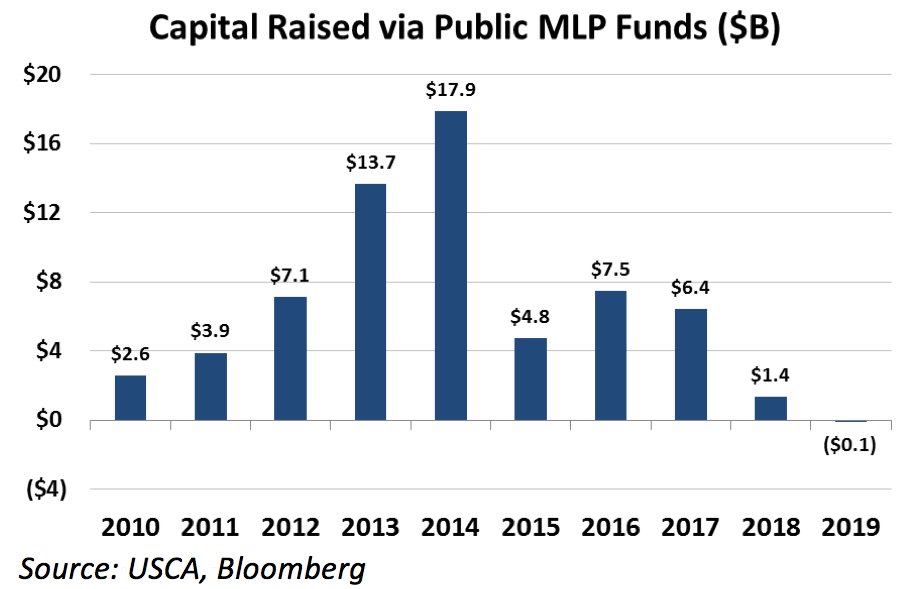
We’ve been watching money flows like a hawk since 2013, with a view that new blood was critical to moving the space higher, or at least digesting what used to be a constant stream of equity issuance. We define money flows as capital raised via publicly traded, MLP-dedicated exchange-traded funds (ETFs), exchange-traded notes (ETNs), and mutual funds.
MLP money flows peaked in 2014 at about $18 billion. Last year saw less capital raised via these funds than in any previous year this decade, as inflows managed only $1.4 billion. Through May 2019, the space has seen $130 million in outflows, and since July 2018, cumulative outflows have been $1.4 billion.
The industry is seeing these paltry inflows and even outflows despite tremendous progress in deleveraging balance sheets, increasing coverage of the distribution, self-funding capital spending, and improving corporate governance. We think this lack of flows explains the recent outperformance of large-cap midstream C-corps versus the AMZ. But there is more to the story.
Distributions Are Critical, Too
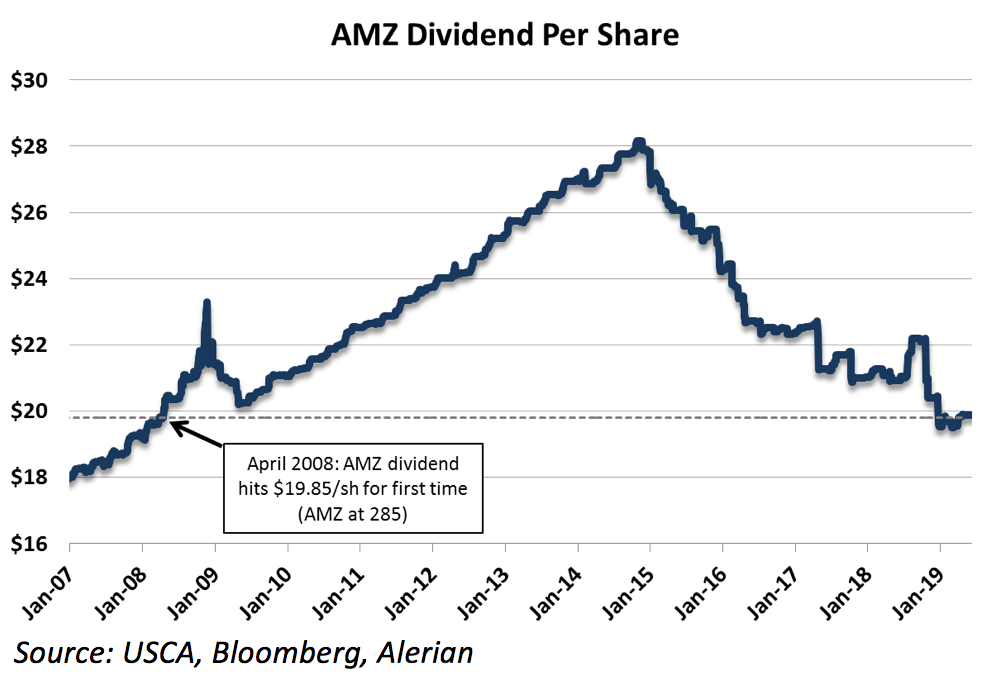
Since its peak in 2014, the AMZ dividend is down 29%, through a combination of outright distribution cuts, “backdoor” cuts via general partner and limited partner restructurings, and the elimination of higher-yielding names from the index because of mergers. The AMZ dividend is now back to a place it first reached in April 2008.
However, we think the vast majority of these cuts and restructurings are behind us and the industry is poised to grow again, albeit at a much more modest and prudent pace. Consensus Street estimates call for the AMZ to see a weighted-average distribution growth rate of 3–5% for both 2019 and 2020, on top of the current ~8.1% yield.
In the wake of all these cuts and restructurings, MLPs and midstream equities, as a group, are better positioned structurally than at any time in the recent past.
What Gets Inflows Going Again?
We debate this question internally, but my view is that the incremental buyers of MLP units are going to be the MLPs themselves, once balance sheets are fully right-sized and capital spending crests.
Our universe of about twenty midstream companies is geared up to spend over $30 billion on new infrastructure in 2019, following a spend of roughly that same amount in 2018. Projects run the gamut of the midstream value chain, but are dominated by oil, natural gas, and natural gas liquids pipelines, primarily to provide egress for Permian hydrocarbons, as well as by new export facilities, since the vast majority of incremental U.S. production will need to move overseas.
We see capital spending declining by about 30% in 2020 and another 20% in 2021. Less capital spending frees up cash that can be returned to shareholders via distributions or unit buybacks, to further reduce leverage or to make acquisitions.
Given the changing MLP model, now focused on a pristine balance sheet and self-funding capital spending, we think the industry is going to increasingly gravitate toward the free cash flow yield metric. Free cash flow is simply operating cash flow minus capital spending. Free cash flow yield is simply free cash flow dividend determined by market capitalization, a relative measure of how much cash a company returns to shareholders.
For perspective, the free cash flow yield of the S&P 500 is currently around 4.5%. Our midstream universe has a negative free cash flow yield of ~1% in 2019 (meaning you need to borrow to fund spending). But that grows to 3–4% by 2020 and 6–7% by 2021.

We caution investors to not look at this metric in isolation, as a company can have a high free cash flow yield but an overleveraged balance sheet, and thus need to use excess cash to pay down debt.
Once balance sheets are in order, some companies will resume modest distribution/dividend growth, but increasingly, investors are clamoring for companies to have a meaningful buyback program in their arsenal. That’s particularly true for those companies that view their stock as significantly undervalued.
Just this year, Enterprise Products Partners (EPD) announced a $2 billion unit repurchase program, to be executed opportunistically. Last year Kinder Morgan (KMI), also announced a $2 billion repurchase program. Generating enough free cash flow to allow a major buyback program is not only a huge sign of financial strength, but it also signals you believe the returns on buying back your stock are as good as, if not better than, investing in assets in the ground. Effectively, companies are putting their money where their mouths are.
We think those two buyback programs are the beginning of a trend. By 2021, we believe we will see most of the major, healthy midstream companies with buyback programs in place, providing the next leg of inflows into the space.
Becca Followill is head of research and a senior managing director covering midstream infrastructure at U.S. Capital Advisors. She is also a member of USCA’s Operating Committee. In addition to more than twenty years in equity research, her diversified energy background includes experience in reservoir engineering, power plant development, and natural gas pipeline planning and operations. Prior to joining U.S. Capital Advisors, she was a managing director and head of midstream research for Tudor, Pickering, Holt & Co., covering pipelines, integrated natural gas companies and midstream providers. Before that, she was with Howard Weil, covering the gas and power sectors and with Merrill Lynch, covering natural gas utilities. She also spent 11 years working for various Tenneco divisions, including Tenneco Inc., Tennessee Gas Pipeline and Tenneco Oil Company. Thomson Reuters named Followill as the number two stock picker for Oil, Gas and Consumable Fuels for 2016. In 2019, she was named one of the 25 Influential Women in Energy. Followill has a bachelor’s of science degree in Petroleum Engineering from Texas A&M University and a Master’s of Business Administration from the University of Houston. She resides in Houston with her husband.